

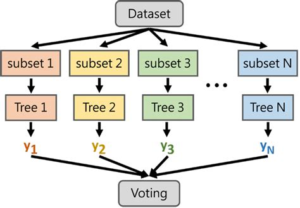
Random Forest Classifier:
Random Forest Classifier is an ensemble algorithm which works with multiple algorithms parallelly. This is a supervised algorithm and it can be used with both classification and regression problems. The output of the new data is estimated either by using majority voting or average voting technique. Since the algorithm works with bagging technique, multiple decision trees are used to provide the output for the specific input. This is a key difference between decision trees and random forests. While decision trees consider all the possible feature splits, random forests only select a subset of those features. Random forest works best with large datasets and high dimensional.
References:
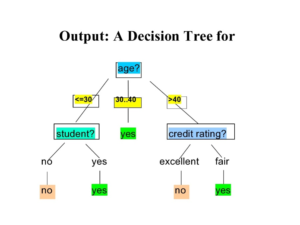
Decision Tree Classifier:
A decision tree is a tool for making decisions and the process for making decisions is in a tree like structure, decision tree is a supervised machine learning algorithm mainly used for predicting the outcome after computing all the attributes. The process flow of Decision tree goes from Root node to leave node i.e., the decision node.
References:
- https://www.ibm.com/topics/decision-trees
- https://www.mastersindatascience.org/learning/introduction-to-machine-learning-algorithms/decision-tree/
Support Vector Machine:
Support vector machines are basically a supervised learning algorithm which classifies the data points by drawing a linear curve and a non-linear curve depending on the data it is dealing with. The boundary that separated the 2 or more classes is called as a hyperplane, though there is a possibility of having some million hyperplanes for our data, but we need to find the hyperplane with maximum margin from all the training points, which makes the algorithm more efficient while predicting on new dataset, it can easily classify on which side the new data belongs to.
References:
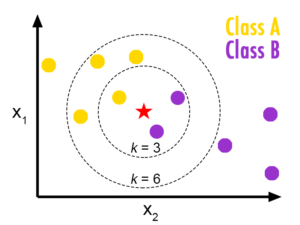
Nearest Neighbour:
KNN or K Nearest neighbours is a basic yet an efficient algorithm which is being used in most of the Machine learning application. Since it is a non-parametric i.e. This algorithm doesn’t make any underlying assumption like other algorithms do, such as having specify distribution of data to work with. So, this makes it very easy and understandable to all the users who are using it. The Technique KNN applies in predicting on new data is where it finds the nearest neighbours for the given point and takes a majority voting, whichever class is resided near to the new point, it will be considered as the new class for the new data point.
References:
Make sure you have checked the add to path tick boxes while installing python, anaconda.
Refer to this link, if you are just starting and want to know how to install anaconda.
If you already have anaconda and want to check on how to create anaconda environment, refer to this article set up jupyter notebook. You can skip the article if you have knowledge of installing anaconda, setting up environment and installing requirements.txt
- Install the prerequisites/software’s required to execute the code from reading the above blog which is provided in the link above.
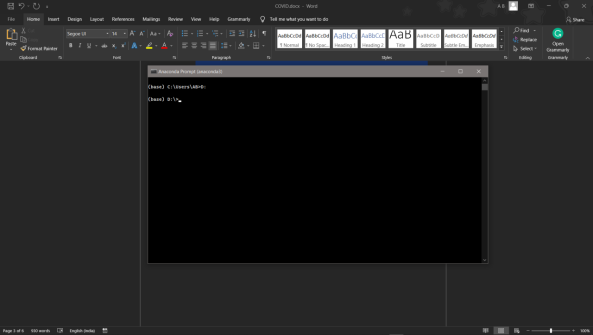
- Press windows key and type in anaconda prompt a terminal opens up.
- Before executing the code, we need to create a specific environment which allows us to install the required libraries necessary for our project.
- Type conda create -name “env_name”, e.g.: conda create -name project_1
- Type conda activate “env_name, e.g.: conda activate project_1
- Go to the directory where your requirement.txt file is present.
- cd <>. E.g., If my file is in d drive, then
- d:
7.cd d:\License-Plate-Recognition–main #CHANGE PATH AS PER YOUR PROJECT, THIS IS JUST AN EXAMPLE
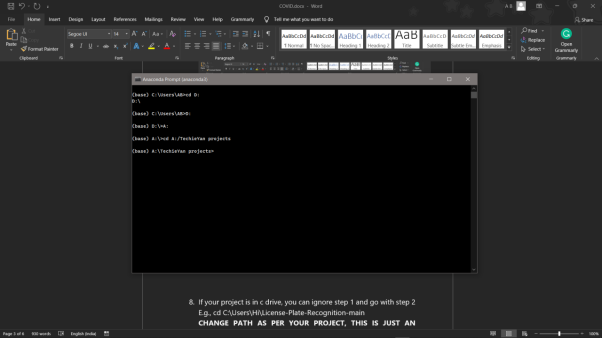
8. If your project is in c drive, you can ignore step 5 and go with step 6
9. g., cd C:\Users\Hi\License-Plate-Recognition-main
10. CHANGE PATH AS PER YOUR PROJECT, THIS IS JUST AN EXAMPLE
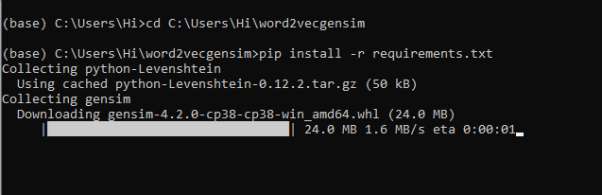
11. Run pip install -r requirements.txt or conda install requirements.txt (Requirements.txt is a text file consisting of all the necessary libraries required for executing this python file. If it gives any error while installing libraries, you might need to install them individually.)
12. To run .py file make sure you are in the anaconda terminal with the anaconda path being set as your executable file/folder is being saved. Then type python main.pyin the terminal, before running open the main.py and make sure to change the path of the dataset.
13. If you would like to run .ipynb file, Please follow the link to setup and open jupyter notebook, You will be redirected to the local server there you can select which ever .ipynb file you’d like to run and click on it and execute each cell one by one by pressing shift+enter.
Please follow the above links on how to install and set up anaconda environment to execute files.
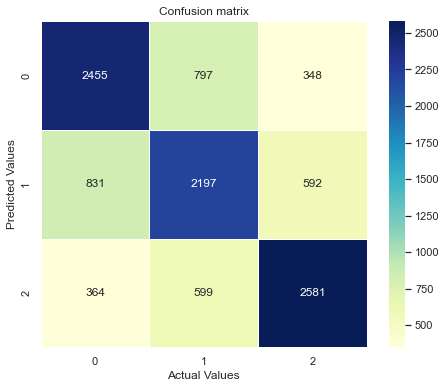
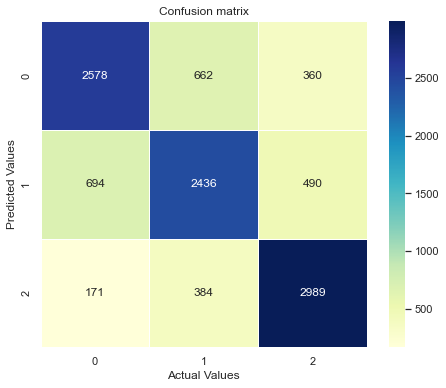
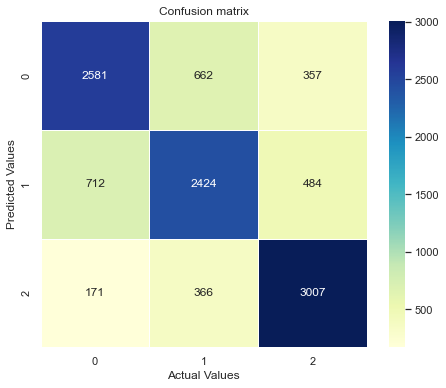

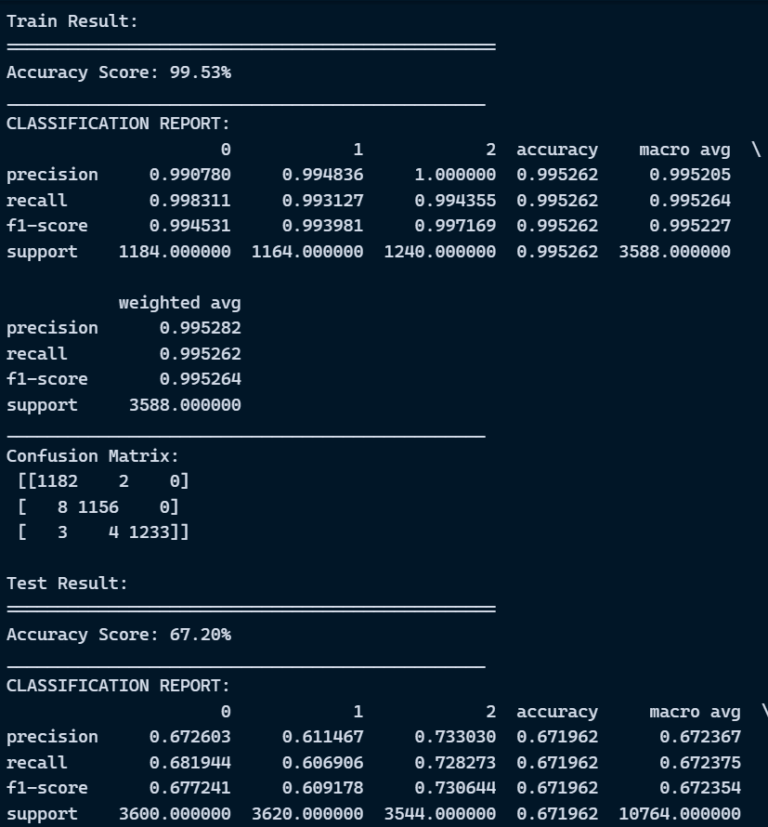
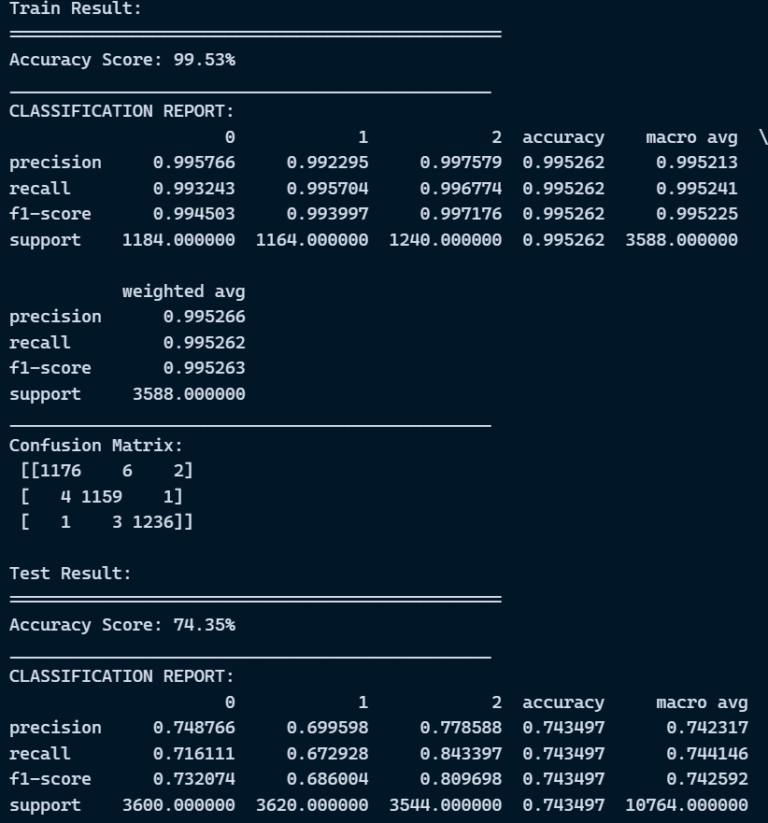
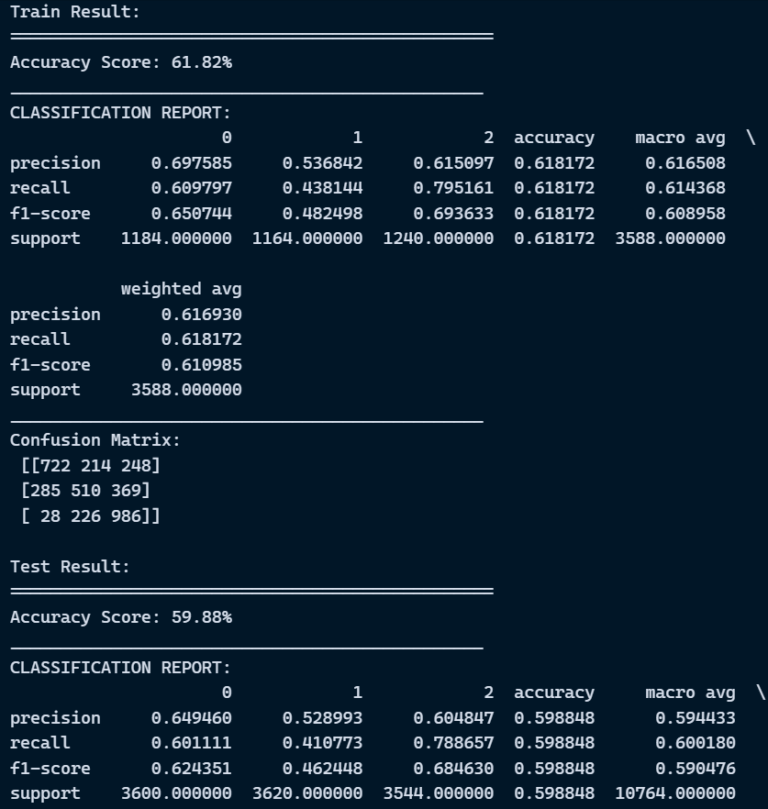
Evaluation metrics are considered as one of the most important steps in any machine learning and deep learning projects, where it will allow us to evaluate how good our Network Severity detection model is performing on the new data or on unseen data. There are a lot of evaluation metrics which can be used in order to assess how good our model is performing such as roc_auc_curve, f1_score, recall, precision and each of which work for specific problem we deal. So, for our project we have gone with confusion matrix and classification report which helps us to evaluate not just the accuracy of the model but also the other metrics such as precision, recall and f1_score.
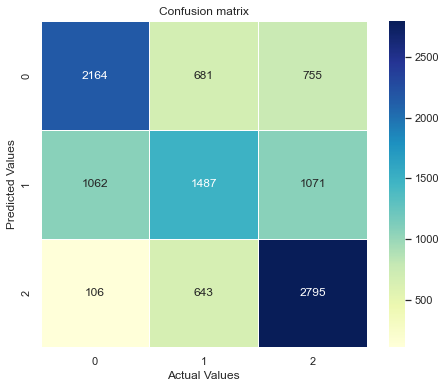
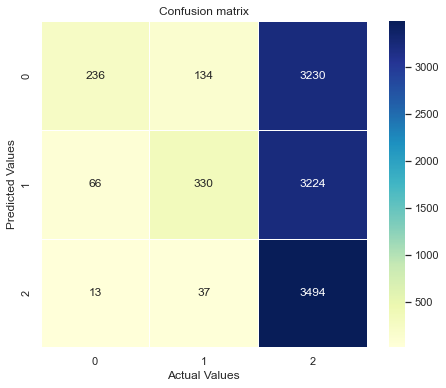
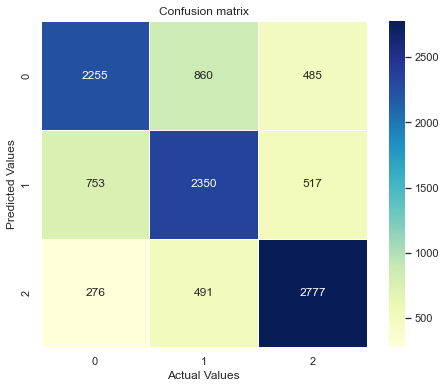
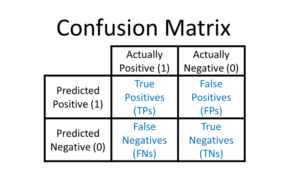
Confusion matrix:
Classification Report: Classification report helps us to understand and evaluate how good the model is performing which consists of different evaluation metrics, such as
Precision: This will count number of correct predictions of a single class divided by the total number of observations of the same class.
Precision = TP/(TP + FP)
Recall: Recall is calculated by counting the actual number of classes in a single class divided by total number of observations of that particular class.
Recall = TP/(TP+FN)
F1_score: This is a Harmonic average of Precision and recall.
F1 Score = 2*(Recall * Precision) / (Recall + Precision)
Reference: