Predicting the trend of the house prices with United States housing data and Regression models
Abstract
Prediction is one of the important features of Machine learning projects and in this project we will be predicting the house prices using XG Boost machine learning model. In this project we will be having tabular data with various features useful for doing house price prediction like city, zip code, flat area, location etc. we will initially train the model on existing dataset and then validating it by giving the model, unknown data as input to do predictions.
Code Description & Execution
Algorithm Description
XG Boost
XG Boost or extreme gradient boosting is a machine learning model which is an advanced implementation of gradient boosting algorithm, used for regression and predictive modeling and it is a supervised learning algorithm.
XG boost is like combination of gradient boost and decision tree where trees are built to and each tree is aimed to reduce the error and the learning’s of the tree are transferred to the other and the prediction is done based on the learning.
How to Execute?
So, before execution we have some pre-requisites that we need to download or install i.e., anaconda environment, python and a code editor. Anaconda: Anaconda is like a package of libraries and offers a great deal of information which allows a data engineer to create multiple environments and install required libraries easy and neat.
Python: Python is a most popular interpreter programming language, which is used in almost every field. Its syntax is very similar to English language and even children and learning it nowadays, due to its readability and easy syntax and large community of users to help you whenever you face any issues.
Code editor: Code editor is like a notepad for a programming language which allows user to write, run and execute program which we have written. Along with these some code editors also allows us to debug, which usually allows users to execute the code line by line and allows them to see where and how to solve the errors. But I personally feel visual code is very good to work with any programming language and makes a great deal of attachment with user.
Note: Make sure you have added path while installing the software’s.
Install the prerequisites mentioned above.
Step1
Open anaconda prompt and create a new environment. To create an environment use the commands given below. Replace env_name by the name of environment you want to give.
conda create -n “env_name”
conda activate “env_name”
Step2
Set up jupyter notebook for your environment
conda install –c conda-forge jupyterlab
conda install –c anaconda ipython
Step3
Install necessary libraries from requirements.txt file provided.
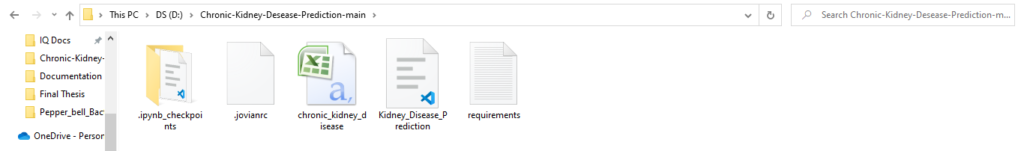
Go to the directory where your requirement.txt file is present.
cd D:\Chronic-Kidney-Desease-Prediction-main
Run command pip install -r requirements.txt or conda install requirements.txt
Requirements.txt is a text file consisting of all the necessary libraries required for executing this python file. If it gives any error while installing libraries, you might need to install them individually. All the required files will be downloaded after you run it. I got requirement already satisfied as I already have them installed.
Step4
To run the code, start jupyter notebook by typing “jupytrr notebook” in command prompt, this will navigate directly to jupyter notebook in your default web browser
Open the folder containing the code, here it is chronic kidney disease prediction. When you run the Kidney_Disease_Prediction.ipynb file, you get the appropriate results.
Data Description
In the given dataset is divided into training and testing dataset which has 81 columns of which 80 are attributes or dependent variables and the last column is the target or independent variable the size of training dataset is (1460×81) and the size of testing dataset is(1460×80) and the target in the test data is predicted using the model
each attribute is a measure of some parameter affecting the price of the house for example:
SalePrice – the property’s sale price in dollars. This is the target variable that you’re trying to predict.
MSSubClass: The building class
MSZoning: The general zoning classification
LotFrontage: Linear feet of street connected to property
LotArea: Lot size in square feet
Street: Type of road access
Alley: Type of alley access
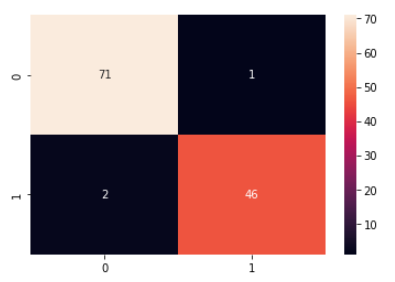
Results
Confusion matrix for KNN classifyer
Issues Faced
While evaluating the house prices model give proper location of the data by checking the size of test dataset as size of the data is small