
LSTM:
If you want to predict the next word for the sentence “I like numbers, my favorite subject is …” your answer would be “mathematics”. How do you come to that conclusion, it is because of the word “numbers”. Recurrent Neural Networks help us achieve this. They are neural networks with loops, allowing the information to stay for some time.
Figure 1: Recurrent Neural Network
Xt is the input, the Network analyzes and throws out output ht. RNNs have performed decently but the problem comes when the sentence is too long and has immense data. E.g. predict the next word for the sentence “I like numbers, my favorite subject is mathematics. My brother likes space and technology, his favorite subject is ….” your answer would be “astronomy”. How do you come to that conclusion, it is because of the word “space and technology”.
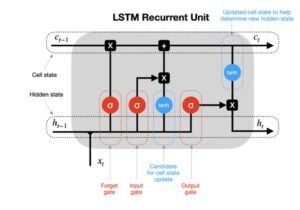
But how does the network know that word mathematics is not important now and “space and technology is important now”. Also the problem with RNNs is it cannot remember the entire sequence for long. Long Short Term Networks (LSTMs) are a special kind of RNN which are very much capable of handling long term dependencies. LSTMs has a cell state which holds the important word/information required for processing. The information in the cell state can be forgotten (removed) or added based on gates. It has 3 gates to help it decide:
1. Forget gate: To forget the information in the cell state. Done with the help of a sigmoid function which returns a value between 0 and 1. If 1 or closer to 1, remove the word else retain the word.
2. Input gate: What input should be given to the cell state done with the help of tan-h function.
3. Update gate: Any information that can be added to the cell state. E.g. : When “space” was in cell state, update it with the word “technology” because word “technology” is important in decision making as well .
To get a clear understanding of LSTM along with mathematical insights, refer to this article https://colah.github.io/posts/2015-08-Understanding-LSTMs/
Reference:
Make sure you have checked the add to path tick boxes while installing python, anaconda.
Refer to this link, if you are just starting and want to know how to install anaconda.
If you already have anaconda and want to check on how to create anaconda environment, refer to this article set up jupyter notebook. You can skip the article if you have knowledge of installing anaconda, setting up environment and installing requirements.txt
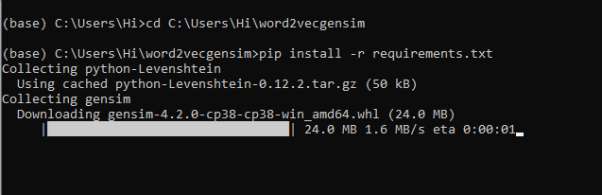
- Install the prerequisites/software’s required to execute the code from reading the above blog which is provided in the link above.
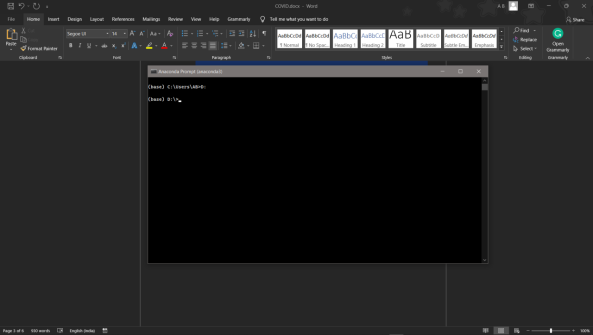
- Press windows key and type in anaconda prompt a terminal opens up.
- Before executing the code, we need to create a specific environment which allows us to install the required libraries necessary for our project.
- Type conda create -name “env_name”, e.g.: conda create -name project_1
- Type conda activate “env_name, e.g.: conda activate project_1
- Go to the directory where your requirement.txt file is present, not just requirement.txt, if you want to execute any .py or .ipynb files, you need to go to that specific folder or path, where they are saved.
- cd <>. E.g., If my file is in d drive, then.
- d:
7.cd d:\License-Plate-Recognition–main #CHANGE PATH AS PER YOUR PROJECT, THIS IS JUST AN EXAMPLE
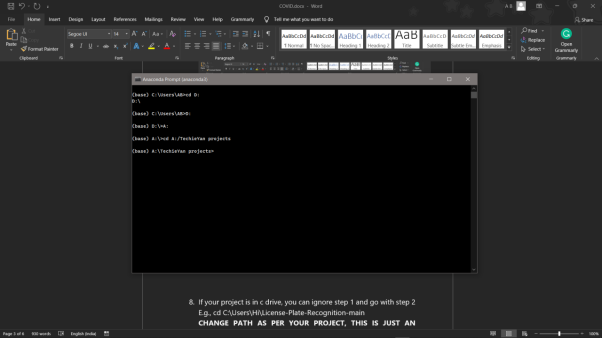
8. If your project is in c drive, you can ignore step 5 and go with step 6
9. g., cd C:\Users\Hi\License-Plate-Recognition-main
10. CHANGE PATH AS PER YOUR PROJECT, THIS IS JUST AN EXAMPLE
11. Run pip install -r requirements.txt or conda install requirements.txt (Requirements.txt is a text file consisting of all the necessary libraries required for executing this python file. If it gives any error while installing libraries, you might need to install them individually.)
12. To run .py file make sure you are in the anaconda terminal with the anaconda path being set as your executable file/folder is being saved. Then type python main.pyin the terminal, before running open the main.py and make sure to change the path of the dataset.
13. If you would like to run .ipynb file, Please follow the link to setup and open jupyter notebook, You will be redirected to the local server there you can select which ever .ipynb file you’d like to run and click on it and execute each cell one by one by pressing shift+enter.
Please follow the above links on how to install and set up anaconda environment to execute files.
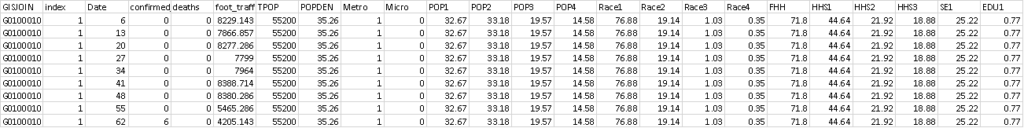
The Dataset was downloaded from Kaggle data Repository which is basically a hub for data nerds, which offers variety of data which can be freely downloaded. The format of the dataset is a .csv file and it consists of around more than 1 lakh data rows each representing a specific date. IT also consists of 51 columns, some of the important columns which contribute more to the model are, Date, Confirmed Cases, Deaths, Population density, Weather control, Total population and more. Below given is an example of how the data looks. The dataset downloaded is day to day statistics of a different counties present in the United States.
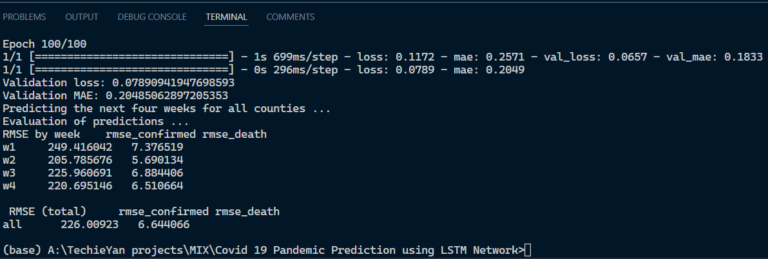
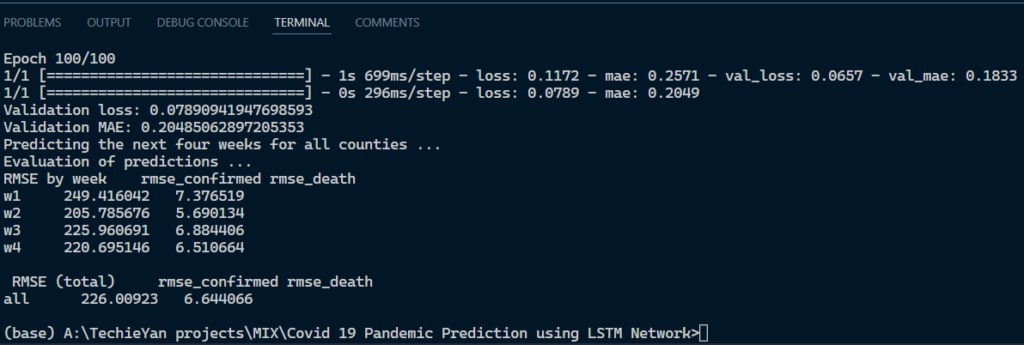
Evaluation metrics helps us to evaluate how good our model is performing going the test data how good it is able to distinguish between the test and train images. So, one such metric that we have used in this project is mean_square_loss, mean_square_loss is calculated by taking in the average of the actual subtracted by average of predicted value and taking a square has whole.